From Black Box to BigQuery: My Journey in Anomaly Detection
Automated anomaly detection is a critical component for any production system. Whether you’re tracking user engagement, ad spend, or infrastructure load, the ability to catch unexpected spikes or dips isn’t just a convenience—it's essential for maintaining a healthy service.This article details a recent client project focused on migrating their anomaly detection system from a managed, “black-box” service, the GCP Timeseries Insights API, to a more transparent and robust solution within their BigQuery data warehouse.I’ll walk through the initial appeal of the simple API and the real-world challenges that ultimately prompted the switch. More importantly, I will provide a practical, step-by-step guide on how we implemented this new, more controllable anomaly detection system for the client using BigQuery ML's powerful ARIMA_PLUS modeling capabilities. 📈
Simple Anomaly Detection with Timeseries Insights API
When a new client’s requirements are straightforward, the goal is always to deliver a robust and maintainable solution without over-engineering. For a recent project, the client was running several Google Ads campaigns and needed a way to automatically monitor key performance metrics like clicks, impressions, cost, and conversions. The data arrived hourly, and the objective was clear: get an alert if any new data point was statistically unusual. This would allow their team to react quickly to underperforming ads or unexpected budget burn.Given this well-defined use case, developing a custom machine learning model from scratch felt excessive for the client’s timeline and budget. This is where GCP’s Timeseries Insights API appeared to be the perfect fit. 🎯 It promised a serverless, out-of-the-box solution designed specifically for this kind of problem. The appeal was undeniable: we could leverage a powerful Google API for our client without taking on the overhead of model training, versioning, and deployment.The initial implementation we rolled out for several clients was as simple as the API’s documentation suggested. The workflow was elegant: an hourly scheduled job would fetch the latest campaign data, format it into the required event structure (a timestamp, metric name, and value), and append it to a dedicated Timeseries dataset. Immediately after, we would query the API to evaluate that newly added point. If the API flagged it as an anomaly, an alert would be fired off to the client's Slack channel. On paper, it was the ideal, low-maintenance solution.
When the Black Box Fails
A monitoring system is only as good as its reliability. While the initial solution built on the Timeseries Insights API was elegant in its simplicity, we soon began to encounter issues that undermined our confidence—and more importantly, our client’s trust in the system. The "black box" nature of the API, which was once an advantage, quickly became its greatest liability. 😥The problems weren’t isolated incidents but a pattern of unpredictability. Our key challenges were:
Unexplained Service Disruptions: On several occasions, the API endpoint would become unresponsive or return server-side errors for extended periods. For a system designed to provide hourly alerts, any downtime is critical. Without a dedicated status page or clear communication, we were left guessing when the service would be restored.Inability to Create New Datasets: Perhaps the most alarming issue was when the API simply stopped allowing us to create new datasets for additional client projects. The calls would fail without any actionable error message, effectively blocking us from onboarding new work using this solution.Opaque Error Messages: When errors did occur, they were often generic, with no specific payload to guide debugging. We couldn’t tell if the issue was with our request format, the data itself, or an internal problem with the service. Troubleshooting became a dead end.Limited Support Channels: As the Timeseries Insights API is not one of GCP’s flagship services, finding dedicated support or even active community discussion threads proved difficult. We were effectively on our own when things went wrong.
Ultimately, these issues amounted to an unacceptable level of operational risk. We could no longer guarantee a reliable monitoring service for our clients with this tool. The decision became clear: we needed to migrate to a platform that offered far greater transparency, control, and reliability, even if it required more setup effort upfront.
A New Direction: Embracing Control with BigQuery ML
Our choice landed on BigQuery ML (BQML). It struck the perfect balance for our client’s needs. It isn’t as complex as building a custom forecasting model on Vertex AI, but it offers leagues more control and transparency than the Timeseries Insights API. We chose BQML for several key reasons that directly addressed the pain points we had experienced:
Data Locality and Simplicity: Most of our clients already use BigQuery as their central data warehouse. BQML allows us to bring the machine learning model directlyto the data. This eliminates the need for separate data pipelines to feed an external API, reducing complexity and potential points of failure.Accessible SQL-Based Interface: Instead of learning another bespoke API, we can train, evaluate, and run anomaly detection using standard SQL commands likeCREATE MODEL. This makes the solution accessible to any developer with SQL skills, not just ML specialists, simplifying long-term maintenance. ✅Transparency and Debugging: As BQML is part of the core BigQuery service, it benefits from the same robust logging and clear error reporting. When a query fails, BigQuery provides an actionable error message. This was a night-and-day difference from our previous struggles, giving us the ability to debug and resolve issues efficiently.
Technical Deep Dive: Building Our Anomaly Detection System in BQML
Now, let’s get into the practical details. Here is the step-by-step process we followed to build the automated anomaly detection system for our client. The entire solution lives within Google Cloud, primarily using BigQuery for the heavy lifting and a simple scheduling mechanism to make it run automatically.
Step 1: Structuring the Data
The first step is to ensure the data is in a clean, structured format that BQML can understand. We created a single table in the client’s BigQuery dataset, let’s call it client_metrics_hourly, with a simple schema:
event_timestamp(TIMESTAMP): The specific hour the data was recorded.metric_name(STRING): The name of the metric (e.g., ‘clicks’, ‘cost’, ‘impressions’).metric_value(FLOAT64): The numerical value of the metric for that hour.
The metric_name column is crucial, as it acts as the time_series_id_col. This allows a single BQML model to intelligently handle all four of our client’s metrics independently.
Step 2: Training and Retraining the ARIMA_PLUS Model
With the data in place, we can train our time-series model. We use the ARIMA_PLUS model in BQML, which is a classic and powerful statistical method for time-series forecasting and analysis.
A critical part of our strategy is periodic retraining. To ensure the model adapts to new trends, a scheduled job re-runs the following CREATE OR REPLACE MODEL query once a week. This keeps the model fresh and relevant to the latest data patterns without requiring any manual intervention from us or the client.
The SQL query to train the model is surprisingly concise:
-- This query is run weekly to retrain the model on the latest data.

CREATE OR REPLACE MODEL `your-project.your_dataset.hourly_metrics_anomaly_model`
OPTIONS(
  MODEL_TYPE='ARIMA_PLUS',
  TIME_SERIES_TIMESTAMP_COL='event_timestamp',
  TIME_SERIES_DATA_COL='metric_value',
  TIME_SERIES_ID_COL='metric_name'
  DATA_FREQUENCY = 'HOURLY'
  HOLIDY_REGION = 'GLOBAL'
) AS
SELECT
  event_timestamp,
  metric_name,
  metric_value
FROM
  `your-project.your_dataset.client_metrics_hourly`;
Step 3: Detecting Anomalies on New Data
This is the core of our hourly monitoring job. After a new data point is loaded into the client_metrics_hourly table, a scheduled function executes a query using the ML.DETECT_ANOMALIES function. This powerful function takes our trained ARIMA_PLUS model and new data as input, returning the data enriched with several analytical columns, most importantly is_anomaly and the expected upper_bound and lower_bound.
-- This query is run hourly to check only the most recent data point.

SELECT
    metric_name,
    metric_value,
    lower_bound,
    upper_bound
FROM
  ML.DETECT_ANOMALIES(
    MODEL `your-project.your_dataset.hourly_metrics_anomaly_model`,
    (
      -- Subquery to select only the latest timestamp to evaluate
      SELECT * FROM `your-project.your_dataset.client_metrics_hourly`
      WHERE event_timestamp = (SELECT MAX(t.event_timestamp) FROM `your-project.your_dataset.client_metrics_hourly` t)
    )
  )
WHERE
    is_anomaly = TRUE;
Here’s an example of the response:
{
  "metric_name": "cost",
  "metric_value": 411.164718,
  "is_anomaly": false,
  "anomaly_probability": 0.8773168879955376,
  "lower_bound": 107.7169352560974,
  "upper_bound": 651.76375638413812,
  "forecast_point": 211.954077630965303
}
Step 4: Automation and Alerting
The final piece is to automate this process and send meaningful alerts to the client. Our setup is straightforward and reliable:
- A
Cloud Schedulerjob runs every hour, right after the new data is expected to land. - It triggers a Cloud Function that runs the ML.DETECT_ANOMALIES query shown above.
- If the query returns one or more rows, the function constructs a
formatted message for each anomaly. - Finally, it sends that message to the client’s dedicated #ad-alerts Slack channel using a
Slack Incoming Webhook.
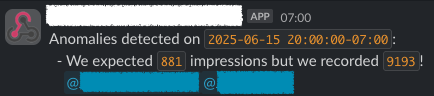
The resulting notification is clean and immediately actionable for the client’s marketing team. Slack is a great tool for this, as it allows for immediate discussion and action right where the alert is surfaced.
Conclusion and Next Steps
Our journey from the Timeseries Insights API to BigQuery ML was a practical lesson in the importance of control and transparency in monitoring systems. While the allure of a zero-maintenance “black box” solution is strong, the hidden costs of unpredictable performance and opaque errors became too high a price for our clients. The migration to BQML represented a strategic shift towards a more durable and trustworthy architecture.
The key takeaway for us is that a small investment in setup—writing a single CREATE MODEL query and a query for detection—provided a massive return in reliability and peace of mind. We traded an “easy button” for a solution that we can debug, control, and confidently support for our clients in the long run.
This successful implementation is not the end of the road, but a new beginning. We are now exploring several enhancements with our clients:
Tuning the ARIMA_PLUS model: BQML allows for manual tuning of ARIMA parameters (p,d,q). We can now work to fine-tune the model for even greater accuracy on specific metrics.Expanding to other use-cases: The same framework can be applied to other time-series data, like website traffic analytics or product sales forecasts.Integrating advanced alerting: For more critical metrics, we might integrate this system with services like PagerDuty to ensure an immediate response from an on-call team.
Join the Conversation
This has been our experience, but every organization’s challenges are unique. The world of cloud services and machine learning is constantly evolving, and there are many valid approaches to solving this problem.I would genuinely be interested to hear from you. Have you faced similar challenges with managed ML APIs? What are your preferred tools for building reliable anomaly detection systems on GCP or other cloud platforms? Please share your thoughts, questions, or alternative approaches on my socials.